
One of the awkward things about print advertising is that it can be difficult to know what happened after the material was distributed.
You can print 5,000 flyers, place signs around a venue or send postcards to customers, but that does not automatically tell you how many people acted on them.
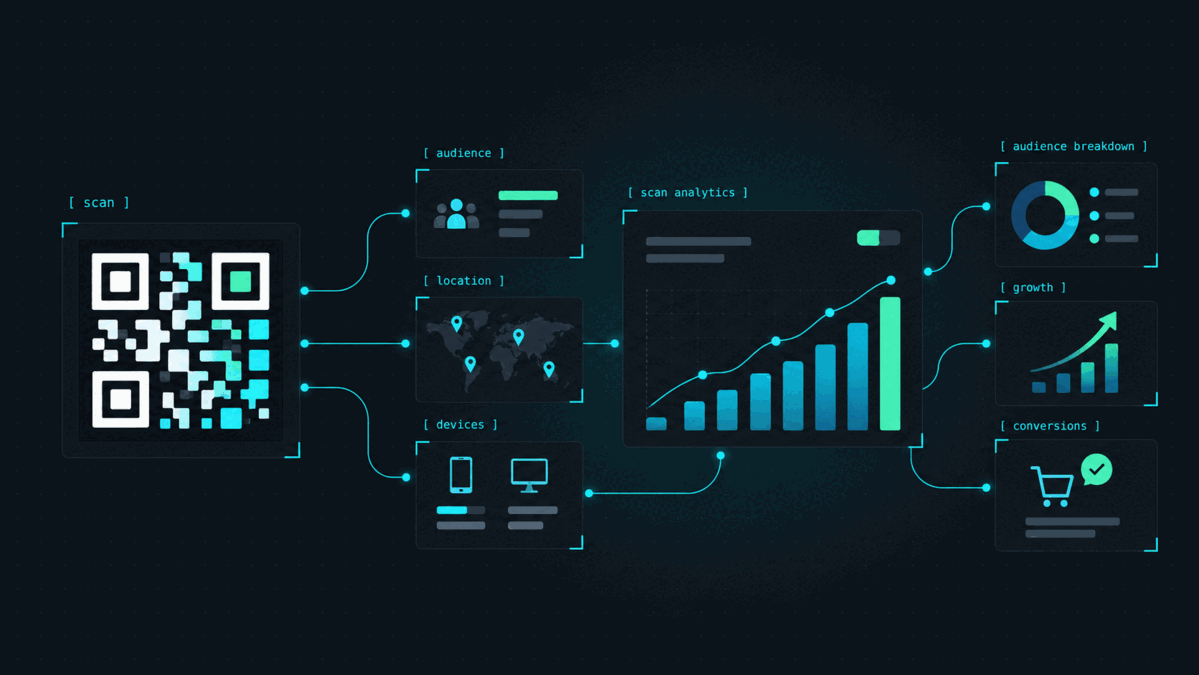
A dynamic QR code creates a measurable point between the printed material and the digital destination.
A scan is a real interaction
A person has to notice the QR code, decide that the information behind it may be useful, take out a phone and scan it.
That does not necessarily mean the person bought something, booked an appointment or submitted a form.
It does mean the printed call to action caused an interaction.
That alone is useful information.
Total scans versus unique visitors
Total scans and unique visitors answer slightly different questions.
Total scans show how often a campaign has been accessed.
Unique visitor estimates help distinguish between many scans from different visitors and repeated scans from the same visitor.
Neither number should be treated as perfect knowledge about a person. They are campaign measurements, not identities.
Used together, they give a better sense of whether a QR campaign is attracting attention and whether people are returning to it.
Compare placements instead of guessing
Analytics become much more useful when different placements use different QR campaigns.
Suppose a restaurant promotes the same offer in three places:
- a window poster
- table cards
- a printed takeaway menu
If all three use the same QR campaign, you can measure the promotion as a whole.
If each location uses its own dynamic QR, you can compare how people respond to each placement.
The result may be very different from what you expected.
Measure before changing the design
Businesses sometimes replace a QR campaign because they assume people are not interested.
The real problem may be the placement.
A QR code tucked into the corner of a poster is different from a QR displayed beside a clear instruction such as “Scan to see today’s menu.”
Before changing the offer, compare how the code is presented.
Scan numbers can help separate a weak campaign from a weak call to action.
Look at the trend, not just the total
A lifetime scan count can be impressive without being useful.
Context matters.
A campaign that received 1,000 scans over two years may be less interesting than one that received 200 scans during a three-day event.
The useful questions are often:
- When did scanning increase?
- Did a new placement improve activity?
- Did an offer create more interest than the previous one?
- Did people continue scanning after the initial campaign?
Analytics do not fix a bad landing page
A high number of scans means people were interested enough to open the QR.
What happens next depends on the page they see.
If the landing page is slow, confusing or unrelated to the promise printed beside the QR, people may leave immediately.
That is why QR analytics should be considered alongside the destination itself.
Give each important campaign its own QR
If measurement matters, avoid using one generic QR everywhere.
Create separate campaigns for placements you want to compare.
The destination can still be the same, while the campaign records remain distinct.
This is especially useful for:
- different stores or locations
- different print publications
- separate events
- different product packages
- multiple versions of an advertisement
Use the numbers to make the next print run better
The value of QR analytics is not simply having a dashboard.
It is being able to make a better decision the next time something goes to print.
If one placement consistently gets scanned and another does not, you have something concrete to work with.
Print no longer has to be completely disconnected from measurement.